
The Squeeze Shows Up in the Saving Rate
American households entered 2026 with a familiar headline: unemployment near 4.3% and jobs still being added. The Bureau of Economic Analysis release for April tells a different story. The personal saving rate fell to 2.6%, the lowest since before the pandemic and down from nearly 5% in January, while real disposable income dropped 0.5% even as nominal spending rose 0.5%.
That gap is the whole problem in one sentence: Americans are spending more dollars to buy less. Forbes framed it as a squeeze that does not look like recession on paper but feels like one in household budgets, with savings draining and credit filling the hole.
Source: Pexels
An Energy Shock Made Essentials More Expensive
The turn came after February 28, when Middle East conflict disrupted Strait of Hormuz shipping and oil markets repriced within days. Brent crude started the year near $61 per barrel, finished Q1 at $118, and still sat near $96 in late May, 57% above January. The Energy Information Administration recorded the largest inflation-adjusted quarterly oil jump in data going back to 1988; gasoline crossed $4 per gallon nationally by March and reached $4.47 by May.
Energy hits lower-income households first because there is less room to absorb a $1.50-per-gallon increase. Those pump prices are still working through fertilizer, packaging, and grocery costs on a lag, which means the full pass-through to supermarket bills may not have arrived yet. That helps explain why consumers kept spending even as real income fell: many categories simply cost more, not because families chose to splurge.
Sentiment Collapsed Even Where Jobs Held Up
Labor data alone would suggest steadiness. Payrolls added 115,000 jobs in April, and the Conference Board's labor-market index held at 93.1 in May. Yet the University of Michigan purchasing-power survey fell to 44.8, the lowest reading since 1952, while year-ahead inflation expectations climbed to 4.8%. Average hourly earnings rose 3.6% over the year; PCE inflation ran 3.8%. People are working, but falling behind on what they earn.
The split between surveys matters. The Conference Board reflects job conditions; Michigan reflects what groceries and gas cost. When those diverge, households feel poorer even in a growing economy. Part-time work for economic reasons jumped 445,000 in April to 4.9 million, a reminder that the headline job count hides softer edges in the labor market.
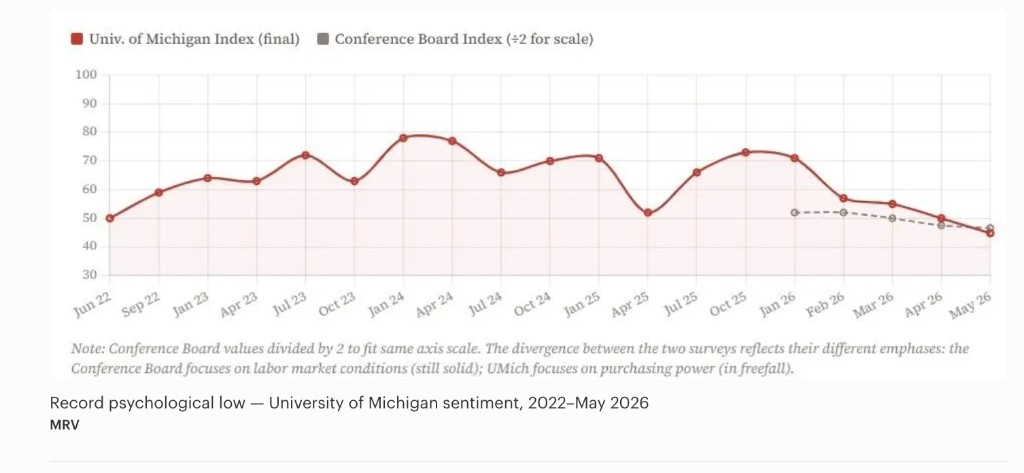
Source: Forbes (BEA Personal Income and Outlays, April 2026)
Debt and BNPL Are Filling the Gap
When savings cannot bridge the gap, borrowing does. Total credit card balances reached $1.252 trillion in Q1 2026, according to the Federal Reserve Bank of New York, up 63% from the pandemic-era low and $325 billion above the pre-pandemic record. Aggregate delinquencies look tame at 2.92%, but at smaller banks where lower-income borrowers concentrate, the rate is 6.43%.
The most telling shift may be buy now, pay later: 29% of users now report using installment loans for groceries, more than double the share from two years ago, and 47% made at least one late payment in the past year. BNPL is no longer mainly a checkout convenience for discretionary purchases; for many households it has become a way to cover necessities between paychecks.
Final Thought: Q1 GDP was revised down to 1.7% annualized with quarterly PCE inflation at 4.5%. The economy is still growing, but slowly, while prices move faster. The takeaway for consumers is not panic but clarity: this is a purchasing-power crisis more than a job-market collapse, and the data suggests households are coping with savings drawdowns and debt until something gives on inflation or income.
Sources
- Forced To Spend More, Affording Less: American Consumers In 2026 — Forbes
- Bureau of Economic Analysis — Personal Consumption Expenditures
- U.S. Energy Information Administration — Petroleum
- University of Michigan Surveys of Consumers
- Federal Reserve Bank of New York — Household Debt and Credit
- The Conference Board — Consumer Confidence